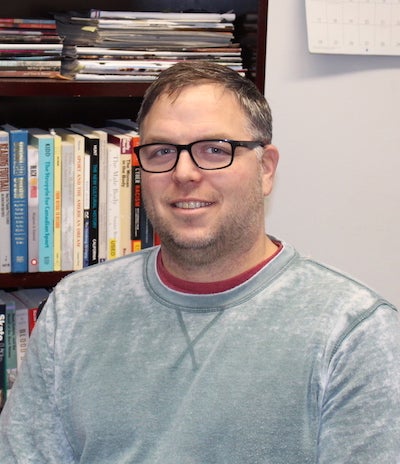
Name: Matt Hodler
URI Title: Assistant Professor of Sports Media and Communication
Email: matthew_hodler@uri.edu
Pronouns: he/him/his
This fall, the College of Arts and Sciences welcomed several new Professors on the tenure-track. Assistant Professor Matt Hodler, Ph.D., joined our Harrington School of Communication and Media’s new Sports Communication and Media program. Dr. Hodler brings a breadth and depth of experience to his new role, having previously held positions at the University of North Carolina at Greensboro, the University of Iowa, and Miami University. His research explores “how meanings of gender, race, nation, dis/ability, and social class are performed, (re)produced, and remembered through sport and physical activity.” Hodler is currently authoring pieces that explore how meanings of nation, modernity, gender, and whiteness are reproduced through mediated representations of Michael Phelps and swimming. “I am also working on a project about social media memes reacting to Colin Kaepernick’s protests,” he says, “and what they might tell us about meanings of citizenship, gender, race, and sport.”
“Aside from getting to work with great colleagues and undergraduate students,” Hodler says, “URI’s Harrington School geographic and academic locations will elevate my next research projects.” These upcoming projects include researching the role of sport in the construction of whiteness and nationality through a study of Gaelic Athletic Association sports, including the Fenway Hurling Classic. Another is a prospective documentary or multi-media study on the experiences of female Olympians—a project that lends itself well to the Harrington School’s body of media resources. In keeping with these interests, Hodler will lead such courses as Introduction to Sports Media and Communication and Special Topics in Communication.
He looks forward to engaging with other College of Arts and Sciences faculty and with students interested in diving into these big ideas. Hodler elucidates that sports media — like the liberal arts in general — allow us to think critically about ways in which we can make our world a better, more equitable place. “Through sport,” he says, “we can learn about meanings of race, gender, sexuality, nationality, and dis/ability” by grappling with critical questions, including: “What did the so-called Black Power Salute at the 1968 Olympics tell us about race? What is the relationship between masculinity and football? What did Rapinoe mean when she said teams couldn’t win without gay players during this World Cup? Why do we play the national anthem before sporting events? Why is it so much harder to find a way to watch the Paralympics on TV?” Accordingly, he asks that students enter is classroom prepared to ask challenging questions like these themselves. “We learn best when we are prepared and willing to challenge ourselves – and we’ll have fun in that kind of classroom too.”